Between 2025 and 2035, the global refining industry is expected to undergo a dramatic transformation driven by demand shifts, decarbonization pressures, and rising competition from mega-integrated complexes. According to Wood Mackenzie, approximately 101 out of 420 refineries worldwide, representing 18.4 million barrels per day (mb/d) or 21% of global capacity, are at high risk of closure by 2035.

The key differentiator will be petrochemical integration. Only 29 of the 101 at-risk refineries are integrated with petrochemical production, underscoring that deeply integrated complexes are more resilient and better positioned to thrive in a decarbonizing world.

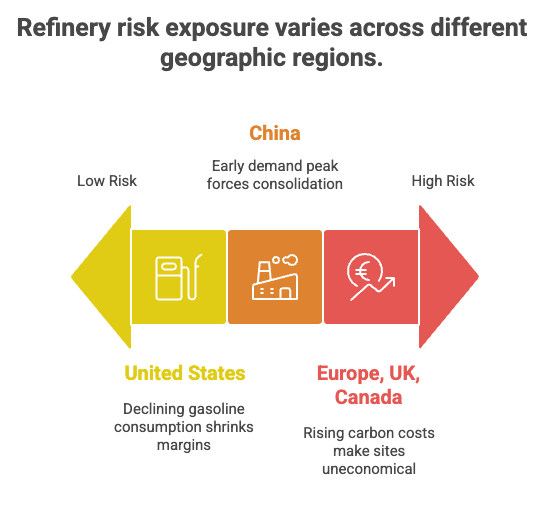
This wave of rationalization and conversion is not evenly distributed. Risk is concentrated in regions where carbon costs are escalating, gasoline demand is eroding, and capital expenditures for decarbonization are intensifying.

  • Europe, UK, and Canada: Rising carbon pricing and stricter environmental compliance make many marginal sites uneconomical.
  • United States: Declining gasoline consumption driven by electric vehicle (EV) adoption is shrinking margins.
  • China: A demand peak earlier than anticipated is forcing consolidation, particularly among smaller independent refiners.

As a result, operators must decide whether to reinvest in modernization, pivot toward alternative operations like renewable fuels, or exit completely.

Drivers of the Refinery Rationalization Wave

Demand Mix Shift:
Gasoline demand is plateauing globally, especially in developed economies with accelerating EV penetration. Diesel and jet fuel demand remain stronger but are highly volatile, leaving catalytic-heavy, simple refineries under pressure.

Carbon and Compliance Costs:
Rising carbon prices and stricter environmental standards increase baseline operating costs, disproportionately impacting non-integrated refineries with limited petrochemical revenue streams.

Decarbonization Capital Needs:
Investments in hydrogen production, electrification, carbon capture and storage (CCS), and renewable feed flexibility are proving too expensive for many late-life assets.

Competition from Mega-Complexes:
Large-scale refineries in China and the Middle East benefit from scale, lower energy intensity, and petrochemical uplift, outcompeting older, less efficient plants globally.

2025: The Acceleration Begins

United States

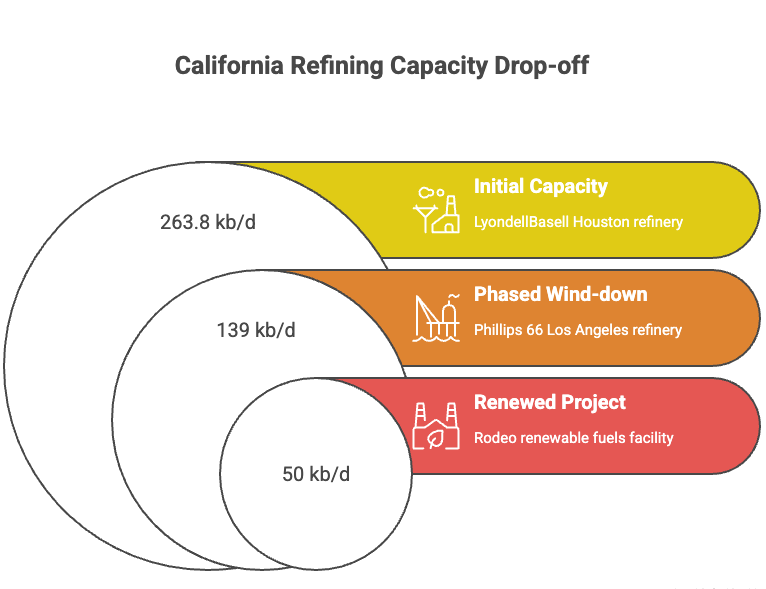
  • LyondellBasell Houston (263.8 kb/d): Permanent closure in 2025, with hydrotreaters repurposed for recycled plastics production.
  • Phillips 66 Los Angeles (~139 kb/d): Phased wind-down, ceasing operations by Q4 2025, impacting approximately 900 jobs.
  • Rodeo Renewed Project: Successful conversion to a 50 kb/d renewable fuels facility producing renewable diesel (RD) and sustainable aviation fuel (SAF).
  • Watchlist – Valero Benicia: Local reports indicate potential closure planning by April 2026. Combined with Phillips 66 LA, this could eliminate roughly 20% of California’s refining capacity.

Europe

  • Grangemouth, UK (~150 kb/d): Crude processing ended on April 29, 2025. The facility is transitioning into a key import terminal.
  • Grandpuits, France: Conversion into a zero-crude platform, focusing on SAF production and advanced plastics recycling.

China
Earlier-than-expected peak oil demand is projected to put 10% of refining capacity at risk over the next decade. Smaller independent “teapot” refiners are most vulnerable as the government drives consolidation toward large, coastal integrated hubs.

Regional Impact (2025–2030)

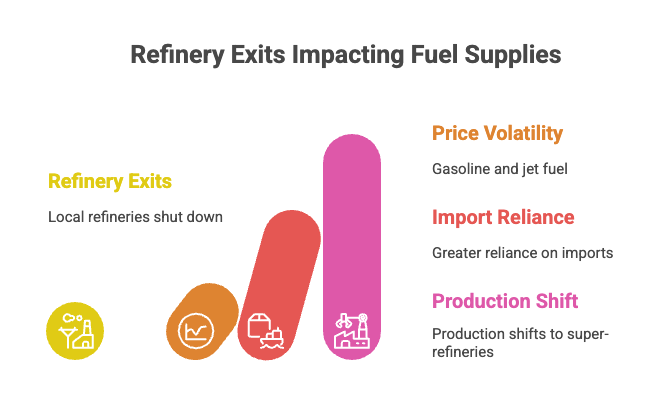
  • California: Rapid refinery exits will tighten local gasoline and jet fuel supplies, increasing price volatility and reliance on imports that must comply with stringent CARBOB and LGIR specifications.
  • UK and Northwest Europe: Greater reliance on imported products as local refineries shut down. Exposure to the EU Emissions Trading System (ETS) keeps marginal sites fragile.
  • China: Independent refiners are expected to be phased out, shifting production to state-backed, petrochemical-integrated super-refineries.

Strategic Off-Ramps and Market Implications

Refineries are adapting by converting into renewable fuel and recycling hubs, as seen with Phillips 66 Rodeo, TotalEnergies Grandpuits, and Eni Venice/Gela, or shifting to logistics roles like Grangemouth. These transitions can cause temporary gasoline and diesel price swings, with diesel remaining more stable. Growing reliance on imports increases supply chain vulnerabilities. To stay competitive, operators should stress-test margins through 2035, integrate petrochemicals, focus on decarbonization projects like hydrogen and SAF, and consider terminal conversions where logistics value surpasses capital costs.

OMS Perspective

At OMS, we recognize that the refining landscape is entering one of the most turbulent decades in its history. As global capacity rationalizes and low-carbon transitions accelerate, we are focused on supporting operators and investors through:

  • Scenario modeling to anticipate risks and opportunities.
  • Margin stress-testing under various demand and carbon pricing scenarios.
  • Evaluation of renewable and low-carbon projects to identify profitable pathways forward.

Our mission is to help industry stakeholders navigate volatility, unlock integration opportunities, and develop resilient strategies that position them for success through the 2025–2035 transition.

Global oil refiners saw profit margins climb to a 14-month high in May, lifted by plant closures in Europe and the U.S., lower fuel inventories, and peak summer demand. The rally has provided a reprieve for a sector expecting weaker returns later this year.

Wood Mackenzie reported global composite refining margins at $8.37 per barrel in May 2025, their highest since March 2024, but well below the $33.50 average in June 2022 during the post-pandemic surge. Analysts say closures and outages have tightened supply, pushing margins higher despite crude prices hitting a four-year low after OPEC+ accelerated output increases.

Europe has seen shutdowns at Petroineos’ Grangemouth plant, Shell’s Wesseling facility, and part of BP’s Gelsenkirchen site. In the U.S., LyondellBasell closed its Houston refinery, while Phillips 66’s Los Angeles and Valero’s Benicia refineries are set to shut later in 2025 and 2026. Unplanned outages at Nigeria’s Dangote and Mexico’s Olmeca refineries, along with an Iberian power failure that cut 1.5 million barrels per day of capacity, further squeezed supply.

Fuel inventories in OECD countries dropped by 50 million barrels between January and May, according to JPMorgan. This decline, combined with strong gasoline and jet demand in the U.S. and seasonal heavy fuel oil consumption in the Middle East, has supported margins. Phillips 66 and Marathon Petroleum executives both noted tightening gasoline stocks and steady demand growth in their earnings calls.

Analysts caution, however, that current strength may be short-lived. The International Energy Agency projects global demand growth of 650,000 barrels per day for the rest of 2025, down from nearly 1 million in the first quarter. Rising production as plants capitalize on higher margins, and the impact of trade disputes could erode profitability.

“Refiners should be hedging everything now,” said one veteran trader. “This is as good as it gets.”

Introduction

Hydrocarbon is an organic chemical compound that is extensively used as a fuel. Hydrocarbon Management (HM) refers to the various stages of extraction, shipment, refining, and it mainly aims to balance the input and output of the refinery. Hydrocarbon management is also known as mass reconciliation or mass balance.

This article discusses all aspects of hydrocarbon management in an oil refinery and outlines a methodology to minimize % oil loss by accounting for all losses and measurement calibration.

Elements of Hydrocarbon Management

Considering Hydrocarbon management involves the receipts (tankers, pipelines, or any means of transportation), the refineries (the main process units that transform the raw materials to actual required product), the tank farm, and then finally, the shipments (tankers, pipelines or any means of transportation). Between the shipment and the receipts, there are two sections: tanks and the oil movements, where the transmissions occur with the help of custody transfer meters (high accuracy meters). It is referred to as fence-line balancing.

The tank farm consists of tank inventories and oil movement management. Assets balancing refer to the transfer of goods/stored items between the tanks. The next element is the process units which do the unit balancing and reconciliation of meters. The third important aspect of Hydrocarbon Management in a Refinery is unit balancing.

Hence, we can see that Hydrocarbon management has three major features for checks and balances, namely, fence-line balancing, assets balancing, and unit balancing.

Hydrocarbon Management or Mass Reconciliation Landscape

Figure 1. Hydrocarbon Management Landscape (ABB, 2019)

Essentials of Hydrocarbon Management or Mass Reconciliation

Figure 2. Essentials of Hydrocarbon Management

Importance of Meters Reconciliation

Let us learn what meters are in reconciliation and their importance, with an example. Initially, before manufacturing unit or production starts, refinery mass balancing takes place where characteristics of the crude oil are considered to obtain the specific output product from that crude. The unit LP optimization decides output productions, and meter information is not required at this stage.

Example of process unit

Now that the production process has begun, and consider the stream ‘Fss 1’, the point is set as 20 flow units. If the meter scale of readings is not calibrated right and there are high chances of wrong readings and reads 18 flow units instead of previously set 20 flow units.

Here comes a clash when the controller setpoint says 20 flow units and the unit operator wants to control the unit flow at 20, whereas the actual flow is not 20, and it reads 18 flow units. In this critical case, the controller tries to keep up its set value and push to the set value, i.e., 20, by reading 18. This causes an imbalance, and planning systems goes out of control. Here is where data reconciliation (DataRec) comes to resolve the problem. Data reconciliation (DataRec) monitors the tank level changes for the stream considered ‘Fss 1’ and calculates again.

It performs analyses on whether the meter should have read it as 20 or what can occur if found that it is 18 and corrects the wrongly calibrated meter readings accordingly. This process only corrects the wrong calibration but not in real-time. The meter must be taken out; recalibration must be performed and install again to avoid such misreading.

Meter Calibration leads to safer operation too

Thus, mass reconciliation is an important process that avoids unnecessary errors due to the wrong calibration of meters. Mass reconciliation is done by a yield accountant or analyst and is responsible for the wrong calibration of the meters. Once the production starts, it is hard to find the errors due to the uncalibrated meters, and it leads to massive errors, which is highly difficult to find out. And hence a refinery spends a million dollars in buying an efficient meter; construct the software application for the same to ensure the whole process of hydrocarbon management goes with high accuracy and high efficiency.

Significance of meters reconciliation

Figure. 3 Significance of meters reconciliation

Coriolis meters located at the inlet to a crude tank

Figure. 4 Coriolis meters located at the inlet to a crude tank (Valentine, 2019)

A Refinery Balance Example

Between the receipts and shipments, are the tanks inventory and the unit balancing consisting of process units. Here is a perfect example to demonstrate the input and output of the refineries.

Input Side

Let us consider we have 8.711 million tons of unprocessed raw materials for the production/process unit. Let us assume the receipt is crude oil, and this supply of unprocessed materials is bought from the concerned industries by the refinery. Combining feedstock, then the addition of various other additives, imported gas, slops, and the required fuels, everything comes to a subtotal of 8.683 million tons. The next stage of calculating total process input includes openings/closing stocks, inventory changes. This approximately is 8.711 million tons.

Output Side

On the output side, we have the main output products from the fence line. We also must consider the internal supply of FCC coke, gas, fuel oil to chemical units, and refineries. These are followed by openings/closing stocks which in turn change the inventory to 0.29, contributing to the total output is 8.665 million tons. We can visibly see the difference between the total process input and total processed output, which is 0.046 million tons. This is the actual calculation of the loss; that the refinery loses in a year.

Refinery balance examples

                        Figure. 5 Refinery balance examples

Refinery Loss Estimation

From the above explanation we can conclude there is surely a quiet amount of loses the refinery experiences every year. This loses can be classified into two types. They are accounted losses and unaccounted losses.

Accounted Losses

Accounted losses can be easily determined and estimated by a refinery. These losses include the amount of evaporation of gas to the atmosphere from the tanks, or rims, or pipelines; loss due to eruption or blow, solid waste, drainage wastes, loss due to diffusion, sulfur, and many more. Hence accounted losses are about 80 to 90% and contribute to about 64% of the total loss.

Unaccounted Losses

Unlike the accounted losses estimated, unaccounted losses cannot be determined exactly and contribute to about 35% of the total loss. Thus, as per the previous slide, forty-six thousand tons is the total loss (summation of accounted losses and unaccounted losses) incurred in a refinery.

Distribution of Refinery loss

Figure. 6 Distribution of Refinery loss

Credit and Debits in HM Landscape

Let us get to the core topic of ‘hydrocarbon management landscape’. Till now, discussion focused on how an imbalance occurs and how to resolve it. Yet refineries have their way of overcoming it. This might vary from one refinery to another, but the result is the same.

Credits and Debit Approach

Credits Analyses

Analyzing the credit terms, we must consider the following:

  • Open inventory measured by a Tank Information System (TIS).
  • Crude receipt processed by oil movements system that is controlled by Order Movement Management (OMM).
  • Production unit, which consists of raw materials and meters reconciliation.

Credit and debit in context of Hydrocarbon Management

Figure. 7 Credit and debit in context of Hydrocarbon Management

The above-mentioned credits are all noted in the record book in ERP (Enterprise Resource Planning system) via SAP.

 SAP solution for Hydrocarbon supply chain

Figure. 8 SAP solution for Hydrocarbon supply chain (Emerging Alliance, 2019).

Debits Analyses

Analyzing the debit terms, we must consider the following:

  • Shipments coming from ERP system or OMM
  • Consumption by Order Movement Management (OMM) or Material Accounting Balance also known as MAB

Usage of internal things which comes under accounted loss is noted manually, and it comes under closed inventory which is coming from the tank Inventory System. So, arriving at the result of calculations, refinery loss and gain is a credit minus debit. This calculation is simple as we do in our day-to-day lives to balance our checkbooks.

Business Case for Improved HM

To understand the value of how much money is involved, let us consider an example of a corporation that owns 10 refineries. The values mentioned here are taken from the exact published data, which indicates the real capacity of the refinery. Let us assume that I have 100 dollars per barrel crude price, and the average total loss is calculated as 0.47. If the accuracy of the mass reconciliation software is increased by 10%, the value of the total loss is 0.047.

Case Study for the tangible benefits

Now we can imagine the amount of money the refineries profit depending on the capacity of 145 thousand barrels per day to 450 thousand barrels per day. They do profit with the increasing number of refineries and their capacity. Also, there is an approximate loss of one million dollars to eight million dollars per year for a refinery. If a corporation owns 10 refineries, the loss could be further increased to 25 – 30 million dollars per year. This demonstration is purely based on accurate measurements and accurate estimation of the mass reconciliation process.

Economics of Improved Hydrocarbon Management

Figure. 9 Economics of Improved Hydrocarbon Management

Continuing Education in Hydrocarbon Management or Mass Reconciliation

Refinery professionals responsible for Hydrocarbon Management or Mass Reconciliation must keep abreast with the latest methodology and system to help them reconcile. OMS eLearning Academy offers many online topics, structured courses extending up to 24 hrs of eLearning experience for professional levels. Click here to learn more about the OMS eLearning Academy and online courses in Hydrocarbon Management.

OMS eLearning Academy Architecture

Figure. 10 OMS eLearning Academy Architecture

Additional Resources

  1. https://www.oms-elearning-academy.com/white-paper/

References

  1. ABB. (2019). Oil, gas and petrochemical operations management software, https://new.abb.com/cpm/industry-specific-solutions/oil-and-gas
  2. Emerging Alliance. (2018). SAP Oil and Gas Hydrocarbon Supply, https://www.youtube.com/watch?v=Z7QZ81MwA9s
  3. Valentine, J. (2019). Case study for a high-performing refinery loss control program, https://www.hydrocarbonprocessing.com/magazine/2019/may-2019/process-optimization/case-study-for-a-high-performing-refinery-loss-control-program

Your refinery operations deserve smarter automation

From tank farm control to hydrocarbon loss reduction, Global OMS delivers
digital solutions trusted by refineries worldwide.