Introduction
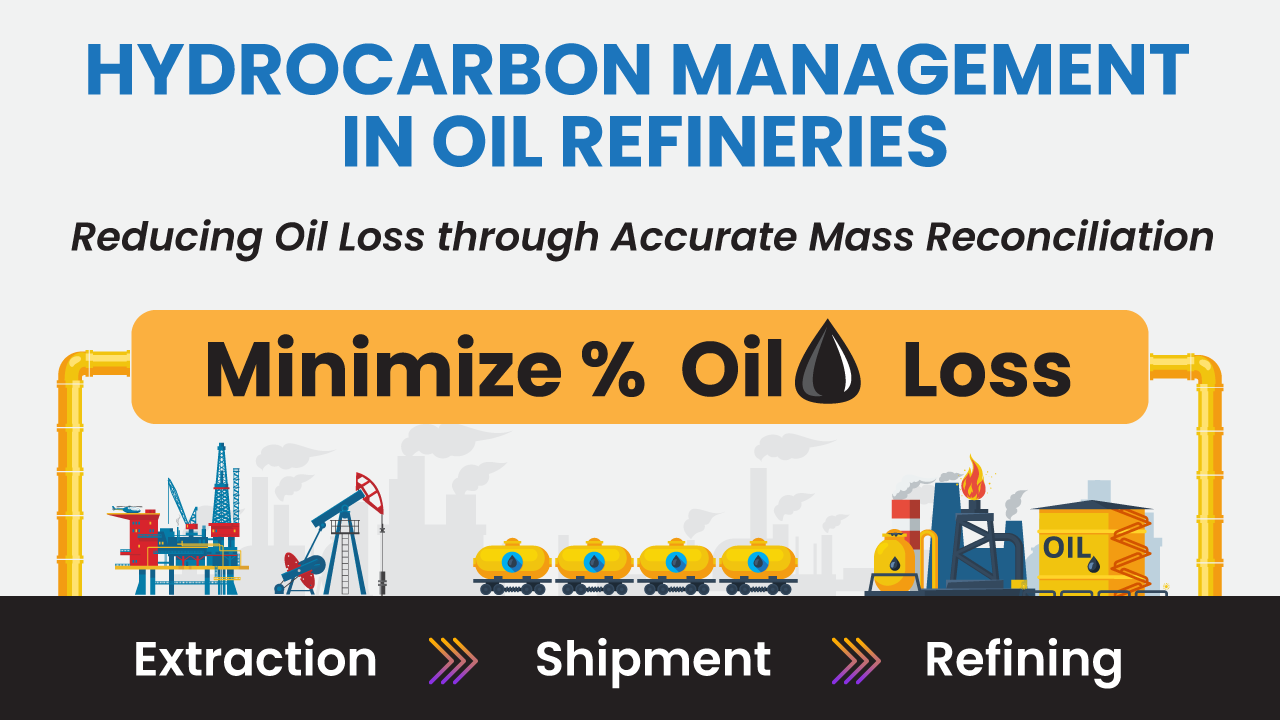
Hydrocarbon is an organic chemical compound that is extensively used as a fuel. Hydrocarbon Management (HM) refers to the various stages of extraction, shipment, refining, and it mainly aims to balance the input and output of the refinery. Hydrocarbon management is also known as mass reconciliation or mass balance.
This article discusses all aspects of hydrocarbon management in an oil refinery and outlines a methodology to minimize % oil loss by accounting for all losses and measurement calibration.
Elements of Hydrocarbon Management
Considering Hydrocarbon management involves the receipts (tankers, pipelines, or any means of transportation), the refineries (the main process units that transform the raw materials to actual required product), the tank farm, and then finally, the shipments (tankers, pipelines or any means of transportation). Between the shipment and the receipts, there are two sections: tanks and the oil movements, where the transmissions occur with the help of custody transfer meters (high accuracy meters). It is referred to as fence-line balancing.
The tank farm consists of tank inventories and oil movement management. Assets balancing refer to the transfer of goods/stored items between the tanks. The next element is the process units which do the unit balancing and reconciliation of meters. The third important aspect of Hydrocarbon Management in a Refinery is unit balancing.
Hence, we can see that Hydrocarbon management has three major features for checks and balances, namely, fence-line balancing, assets balancing, and unit balancing.
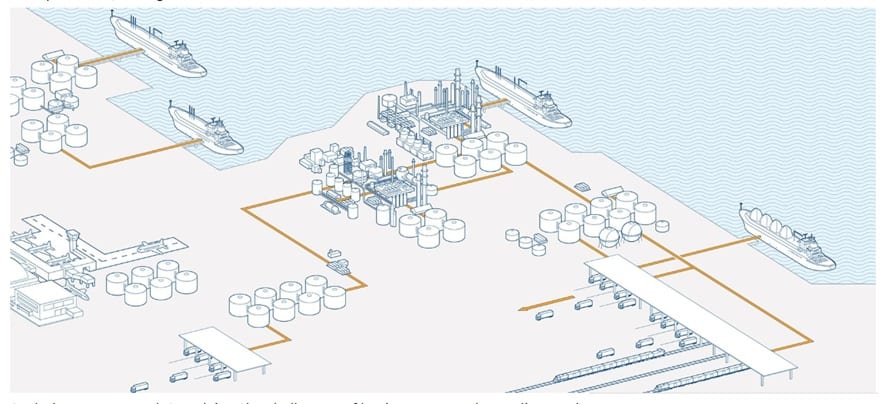
Figure 1. Hydrocarbon Management Landscape (ABB, 2019)
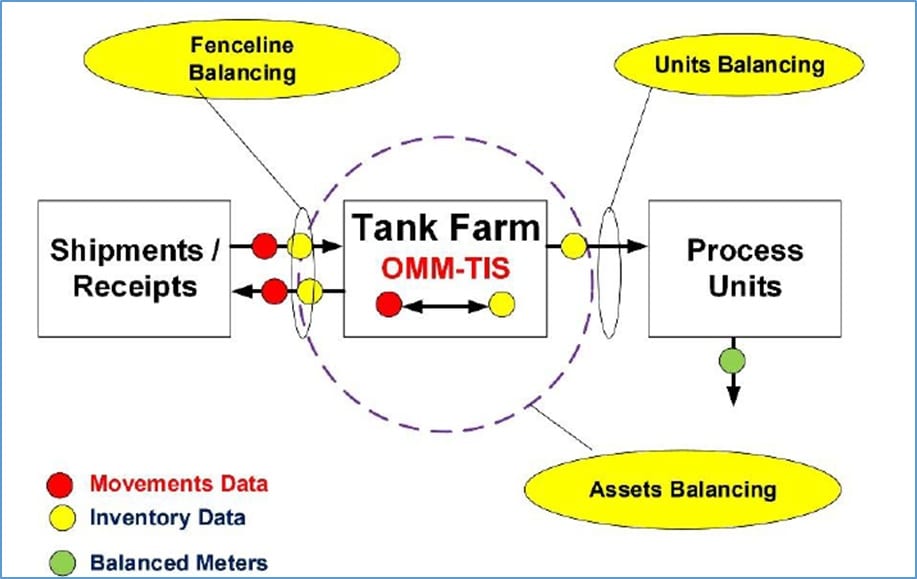
Figure 2. Essentials of Hydrocarbon Management
Importance of Meters Reconciliation
Let us learn what meters are in reconciliation and their importance, with an example. Initially, before manufacturing unit or production starts, refinery mass balancing takes place where characteristics of the crude oil are considered to obtain the specific output product from that crude. The unit LP optimization decides output productions, and meter information is not required at this stage.
Example of process unit
Now that the production process has begun, and consider the stream ‘Fss 1’, the point is set as 20 flow units. If the meter scale of readings is not calibrated right and there are high chances of wrong readings and reads 18 flow units instead of previously set 20 flow units.
Here comes a clash when the controller setpoint says 20 flow units and the unit operator wants to control the unit flow at 20, whereas the actual flow is not 20, and it reads 18 flow units. In this critical case, the controller tries to keep up its set value and push to the set value, i.e., 20, by reading 18. This causes an imbalance, and planning systems goes out of control. Here is where data reconciliation (DataRec) comes to resolve the problem. Data reconciliation (DataRec) monitors the tank level changes for the stream considered ‘Fss 1’ and calculates again.
It performs analyses on whether the meter should have read it as 20 or what can occur if found that it is 18 and corrects the wrongly calibrated meter readings accordingly. This process only corrects the wrong calibration but not in real-time. The meter must be taken out; recalibration must be performed and install again to avoid such misreading.
Meter Calibration leads to safer operation too
Thus, mass reconciliation is an important process that avoids unnecessary errors due to the wrong calibration of meters. Mass reconciliation is done by a yield accountant or analyst and is responsible for the wrong calibration of the meters. Once the production starts, it is hard to find the errors due to the uncalibrated meters, and it leads to massive errors, which is highly difficult to find out. And hence a refinery spends a million dollars in buying an efficient meter; construct the software application for the same to ensure the whole process of hydrocarbon management goes with high accuracy and high efficiency.
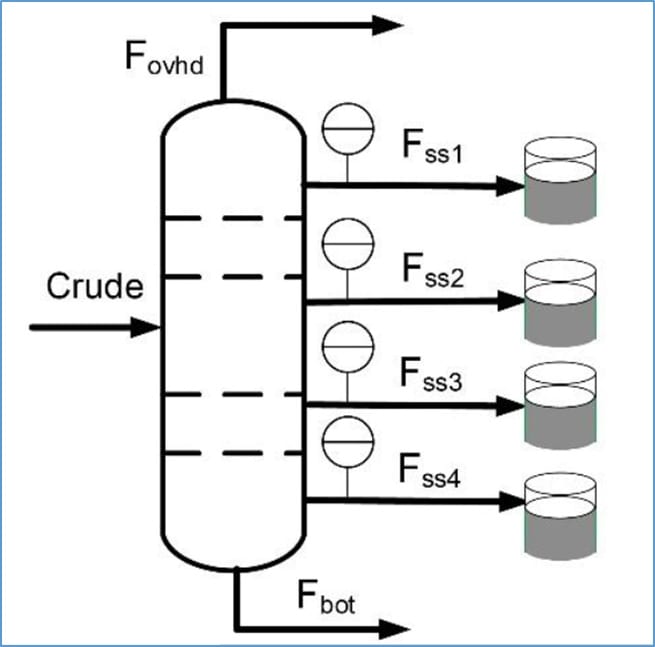
Figure. 3 Significance of meters reconciliation
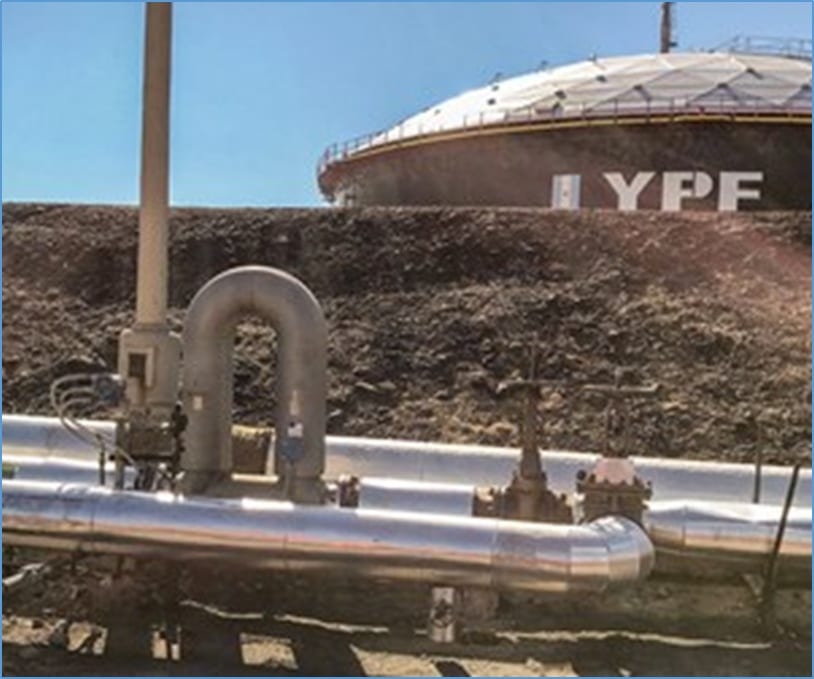
Figure. 4 Coriolis meters located at the inlet to a crude tank (Valentine, 2019)
A Refinery Balance Example
Between the receipts and shipments, are the tanks inventory and the unit balancing consisting of process units. Here is a perfect example to demonstrate the input and output of the refineries.
Input Side
Let us consider we have 8.711 million tons of unprocessed raw materials for the production/process unit. Let us assume the receipt is crude oil, and this supply of unprocessed materials is bought from the concerned industries by the refinery. Combining feedstock, then the addition of various other additives, imported gas, slops, and the required fuels, everything comes to a subtotal of 8.683 million tons. The next stage of calculating total process input includes openings/closing stocks, inventory changes. This approximately is 8.711 million tons.
Output Side
On the output side, we have the main output products from the fence line. We also must consider the internal supply of FCC coke, gas, fuel oil to chemical units, and refineries. These are followed by openings/closing stocks which in turn change the inventory to 0.29, contributing to the total output is 8.665 million tons. We can visibly see the difference between the total process input and total processed output, which is 0.046 million tons. This is the actual calculation of the loss; that the refinery loses in a year.
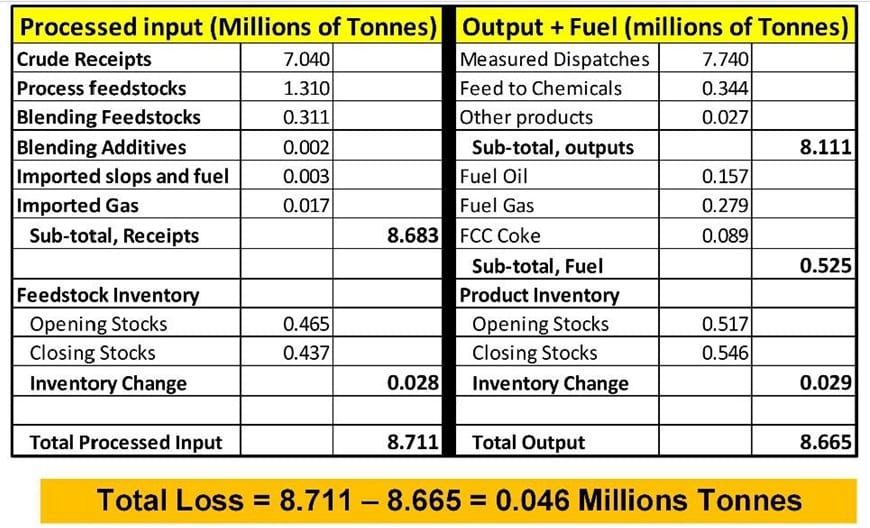
Figure. 5 Refinery balance examples
Refinery Loss Estimation
From the above explanation we can conclude there is surely a quiet amount of loses the refinery experiences every year. This loses can be classified into two types. They are accounted losses and unaccounted losses.
Accounted Losses
Accounted losses can be easily determined and estimated by a refinery. These losses include the amount of evaporation of gas to the atmosphere from the tanks, or rims, or pipelines; loss due to eruption or blow, solid waste, drainage wastes, loss due to diffusion, sulfur, and many more. Hence accounted losses are about 80 to 90% and contribute to about 64% of the total loss.
Unaccounted Losses
Unlike the accounted losses estimated, unaccounted losses cannot be determined exactly and contribute to about 35% of the total loss. Thus, as per the previous slide, forty-six thousand tons is the total loss (summation of accounted losses and unaccounted losses) incurred in a refinery.
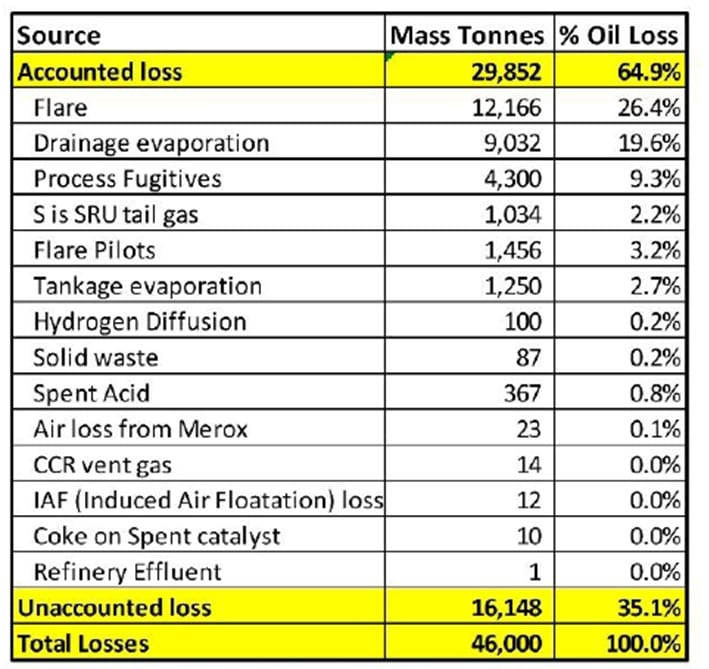
Figure. 6 Distribution of Refinery loss
Credit and Debits in HM Landscape
Let us get to the core topic of ‘hydrocarbon management landscape’. Till now, discussion focused on how an imbalance occurs and how to resolve it. Yet refineries have their way of overcoming it. This might vary from one refinery to another, but the result is the same.
Credits and Debit Approach
Credits Analyses
Analyzing the credit terms, we must consider the following:
- Open inventory measured by a Tank Information System (TIS).
- Crude receipt processed by oil movements system that is controlled by Order Movement Management (OMM).
- Production unit, which consists of raw materials and meters reconciliation.
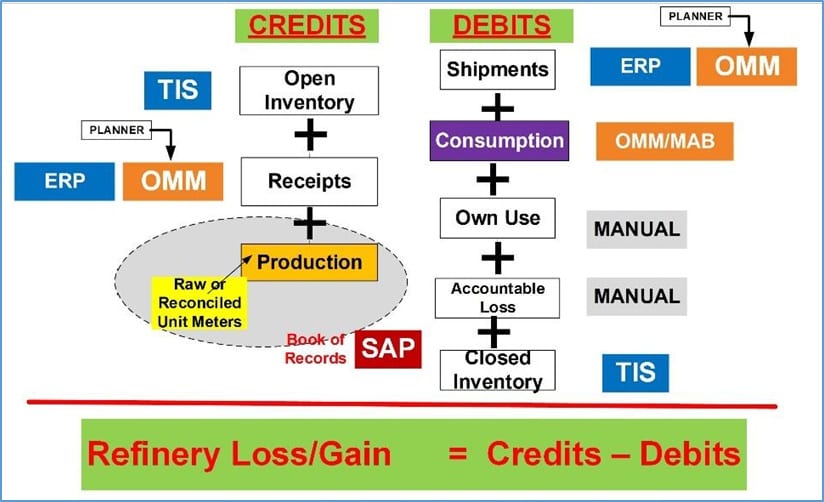
Figure. 7 Credit and debit in context of Hydrocarbon Management
The above-mentioned credits are all noted in the record book in ERP (Enterprise Resource Planning system) via SAP.
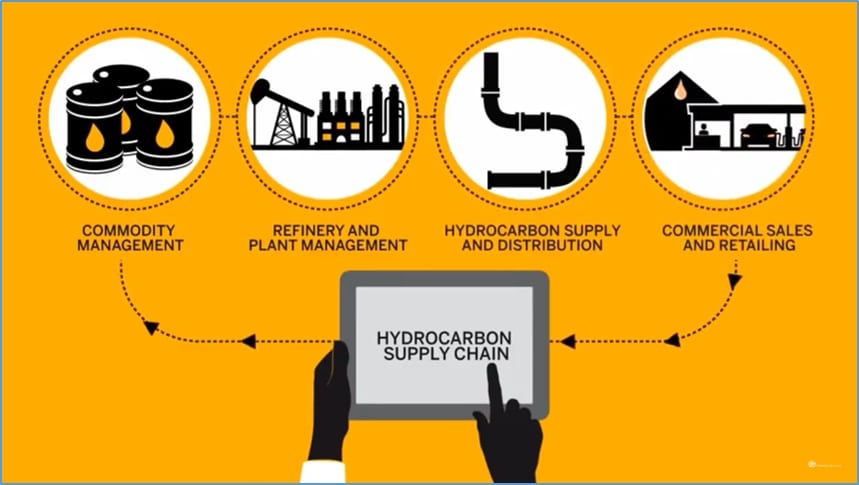
Figure. 8 SAP solution for Hydrocarbon supply chain (Emerging Alliance, 2019).
Debits Analyses
Analyzing the debit terms, we must consider the following:
- Shipments coming from ERP system or OMM
- Consumption by Order Movement Management (OMM) or Material Accounting Balance also known as MAB
Usage of internal things which comes under accounted loss is noted manually, and it comes under closed inventory which is coming from the tank Inventory System. So, arriving at the result of calculations, refinery loss and gain is a credit minus debit. This calculation is simple as we do in our day-to-day lives to balance our checkbooks.
Business Case for Improved HM
To understand the value of how much money is involved, let us consider an example of a corporation that owns 10 refineries. The values mentioned here are taken from the exact published data, which indicates the real capacity of the refinery. Let us assume that I have 100 dollars per barrel crude price, and the average total loss is calculated as 0.47. If the accuracy of the mass reconciliation software is increased by 10%, the value of the total loss is 0.047.
Case Study for the tangible benefits
Now we can imagine the amount of money the refineries profit depending on the capacity of 145 thousand barrels per day to 450 thousand barrels per day. They do profit with the increasing number of refineries and their capacity. Also, there is an approximate loss of one million dollars to eight million dollars per year for a refinery. If a corporation owns 10 refineries, the loss could be further increased to 25 – 30 million dollars per year. This demonstration is purely based on accurate measurements and accurate estimation of the mass reconciliation process.
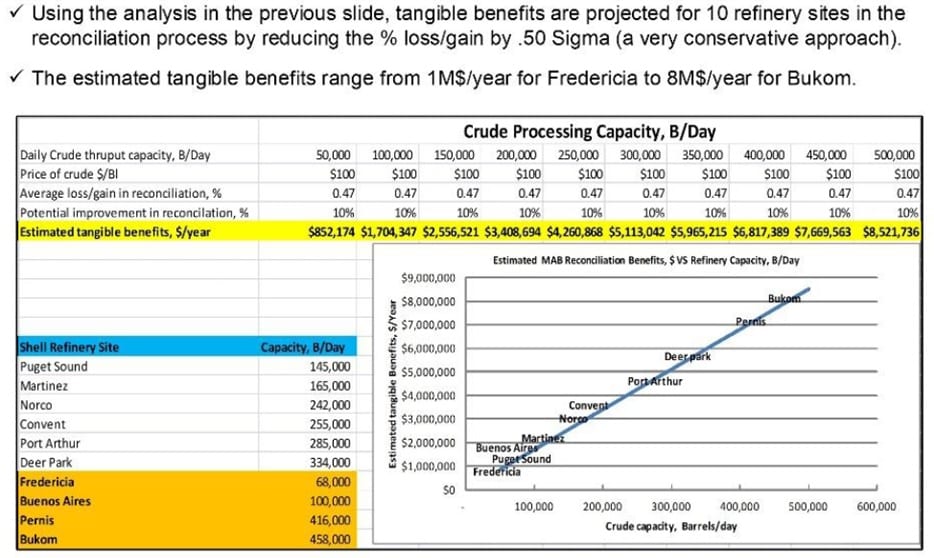
Figure. 9 Economics of Improved Hydrocarbon Management
Continuing Education in Hydrocarbon Management or Mass Reconciliation
Refinery professionals responsible for Hydrocarbon Management or Mass Reconciliation must keep abreast with the latest methodology and system to help them reconcile. OMS eLearning Academy offers many online topics, structured courses extending up to 24 hrs of eLearning experience for professional levels. Click here to learn more about the OMS eLearning Academy and online courses in Hydrocarbon Management.
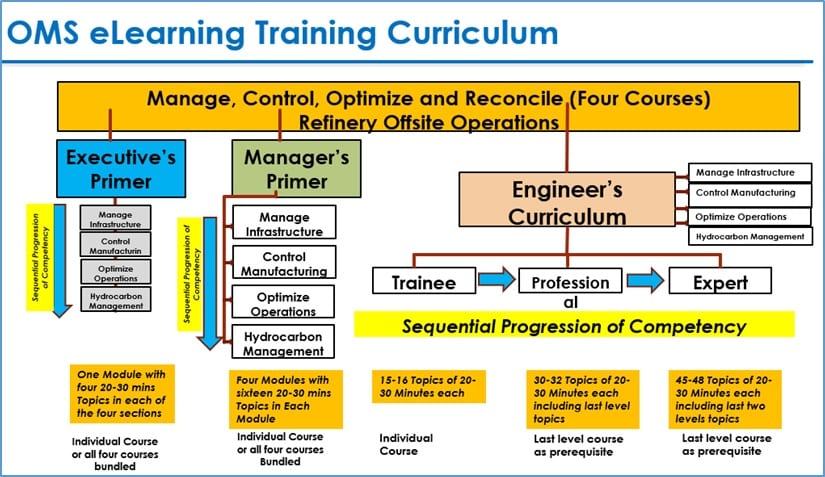
Figure. 10 OMS eLearning Academy Architecture
Additional Resources
References
- ABB. (2019). Oil, gas and petrochemical operations management software, https://new.abb.com/cpm/industry-specific-solutions/oil-and-gas
- Emerging Alliance. (2018). SAP Oil and Gas Hydrocarbon Supply, https://www.youtube.com/watch?v=Z7QZ81MwA9s
- Valentine, J. (2019). Case study for a high-performing refinery loss control program, https://www.hydrocarbonprocessing.com/magazine/2019/may-2019/process-optimization/case-study-for-a-high-performing-refinery-loss-control-program