KPI (Key Performance Indicator) for the OM&S Implementation projects
What is KPI ?
KPIs are commonly used by an organization to evaluate its success of a particular activity in which it is engaged. Sometimes success is defined in terms of making progress toward strategic goals, but often success is simply the repeated achievement of some level of tangible operational goal, for example, blend quality giveaways, % oil loss, energy efficiency, etc.
However, there are cases where KPIs are non-tangible (that is no $$$ value can be assigned to them easily) in nature, e.g. customer satisfaction, innovation, motivation, personal satisfaction, etc.
Accordingly, choosing the right KPIs is reliant upon having a good understanding of what is important to the organization. ‘What is important’ often depends on the department measuring the performance – the KPIs useful to finance will be quite different than the KPIs assigned to sales, for example. Because of the need to develop a good understanding of what is important, performance indicator selection is often closely associated with the use of various techniques to assess the present state of the business, and its key activities.
These assessments often lead to the identification of potential improvements; and as a consequence, performance indicators are routinely associated with ‘performance improvement’ initiatives. Ref: [1]
How to measure KPI for an OM&S project?
Typically, there should always be a baseline or expected tangible benefits range or specifications (as in the case of blending quality giveaways) to compare future values from the installed system. However, in case of OM&S system, tangible benefits ($$$) are very difficult to quantify and time consuming exercise to create either a baseline or calculate new values post deployment. Therefore, the only measurable and conceivable KPI for OM&S is the number of closed movements on a monthly basis. Ref: [2,3]
Based on my industry experience, a typical range of close movements is about 10 -15 movements/per month/per barrel. The number of closed movements decrease as the size (total Storage capacity) of tank farm increases and the number of movements per month increase as the crude processing capacity increases. These two trends cross at an optimum point for a given refinery.
A baseline KPI may be obtained from the total number of monthly closed movements for past 12-24 months. These data can be gathered from earlier systems (pumper logs, advisor) or even manual logs.
Hence, it is important to measure the performance of OM&S post deployment by observing the following conditions:
a. Every material movement in the plant should be planned, executed, monitored, finished and closed in OMM.
b. There should be no other system and/or logs (digital or manual) where such movements are recorded other than OMM.
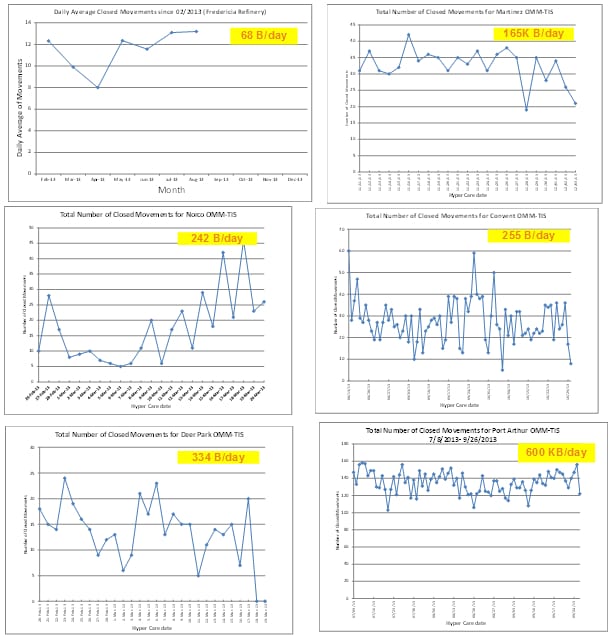
Illustrative Oil Movements KPI from six refineries
The following figures show the daily number of movements for six refineries ranging from 68 kb/day to 600 kb/day.
Conclusion
This paper has discussed the concept of KPI for an oil movement and storage system to assess and justify the benefits of its implementation.
References:
[1] https://en.wikipedia.org/wiki/Performance_indicator
[2] Suresh S Agrawal, Chapter-20 Tank Farm Management, “MNL58 Petroleum Refining and Natural Gas Processing”, Editors: Riazi M., Eser Semih, Agrawal Suresh, Peño Díez José, Published: 2013
[3] Suresh S Agrawal, Chapter-21 Strategic Blending Technology and Management, ” MNL58 Petroleum Refining and Natural Gas Processing”, Editors: Riazi M., Eser Semih, Agrawal Suresh, Peño Díez José, Published: 2013